
In the 50s in New York consistently through January and into February, and I, for one, am terrified. A silver lining of this lovely weather – and the unprecedented storms, wildfires, droughts, heatwaves, etc. – is the increasing impossibility of failing to recognize that the climate crisis is upon us. Utter ignorance, of course, presents little obstacle to many recent converts to climate urgency who are now certain that a carbon tax is on the only solution, or that all that New Green Deal money should go into carbon capture and storage research, or that the world is fucked and we are all going to die anyway, so why bother?
But I too was late in my climate awakening, and can attest that one of the chief barriers – beyond the staggering complexity of the involved phenomena – to beginning to really think about anthropogenic climate disruption (there’s also a lot of specialized vocabulary) or make sense of the IPCC reports (and a ton of acronyms; the preceding one means Intergovernmental Panel on Climate Change), but one of the chief barriers is simply the math.
We should all be familiar with at least the basic math when it comes to the climate crisis, and to that end, a primer:
Greenhouse Gases (Atmospheric Concentrations)
Immediately, we encounter the overwhelmingly complexity. To attempt to cut it down to size, a greenhouse gas is a substance (like carbon dioxide) that traps heat in Earth’s atmosphere. It does so by preventing energy that entered Earth’s atmosphere (in the form of sunlight) from exiting Earth’s atmosphere (in the form of infrared radiation). This trapping of heat has to do with the molecular structure of the gases in question.
As the graph below shows, atmospheric carbon dioxide levels have risen from ~315 parts per million (or ppm) in 1960 to nearly 415 ppm today. I glance at this tracker from NOAA’s Earth System Research Lab every morning.
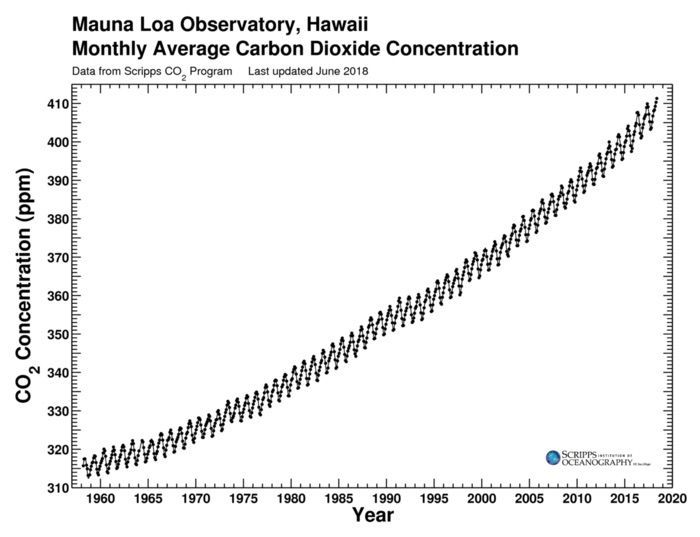
Evidently, for the ~12,000 years (called the Holocene) leading up to the Industrial Revolution, atmospheric carbon dioxide concentration remained pretty steady at around 280 ppm.
Carbon dioxide is not the only, or even the most powerful greenhouse gas though; in fact, methane, nitrous oxide, and various fluorine-containing compounds (known primarily as refrigerants, although they have many uses) are all far more powerful, but thankfully far less prevalent atmospheric warming agents. According to the EPA, once a very reliable source on such matters, in 2010, carbon dioxide accounted for roughly 75% of global anthropogenic greenhouse gas emissions, while methane accounted for ~15%, nitrous oxide for ~5%, the fluorine-containing compounds for ~2%, with the balance made up for by other less common substances and my rounding.
As we all know, carbon dioxide is generated by the combustion of fossil fuels (or of wood, including of vast forests), although our land-use choices – cutting down or planting trees, how we farm, etc. – also impact carbon dioxide emissions levels. In the U.S., leaks from natural gas extraction, processing, and distribution facilities and animal agriculture (ruminant burps and farts) are the primary sources of methane, although human flatulence must also have its role to play. Nitrous oxide emissions originate primarily from our use of synthetic fertilizers, while the fluorine-containing compounds seem to mostly be released in relation to the production, use, and disposal of freezers, refrigerators, and air conditioning units, though I’ll admit to having a limited understanding of these substances.
I believe this is already at risk of becoming too complicated, so suffice to say that methane is at least 20-30x more powerful as a warming agent over the short term (20 to 100 year time horizon) than is carbon dioxide, and nitrous oxide is something like 300x more powerful over the same. Today, methane concentrations in Earth’s atmosphere are approaching 2 ppm while nitrous oxide concentrations are around 300 parts per billion (or 0.3 ppm), and concentrations of the various fluorine-containing compounds are, thankfully, measured in parts per trillion, although they are, in many instances, far more powerful warming agents than even nitrous oxide.
Greenhouse Gases (Total Amount)
In 2010, total anthropogenic greenhouse gas emissions totaled ~49 gigatonnes of carbon dioxide equivalent. Carbon dioxide equivalent is arrived at by considering the global warming potential of a substance (for example, the “20-30x more powerful” mentioned above for methane) and the amount of that substance that was emitted – kind of like saying a dozen is equivalent to twelve, except in this case, you’re talking about how many carbon dioxide molecules say one methane molecule is equivalent to when it comes to warming.
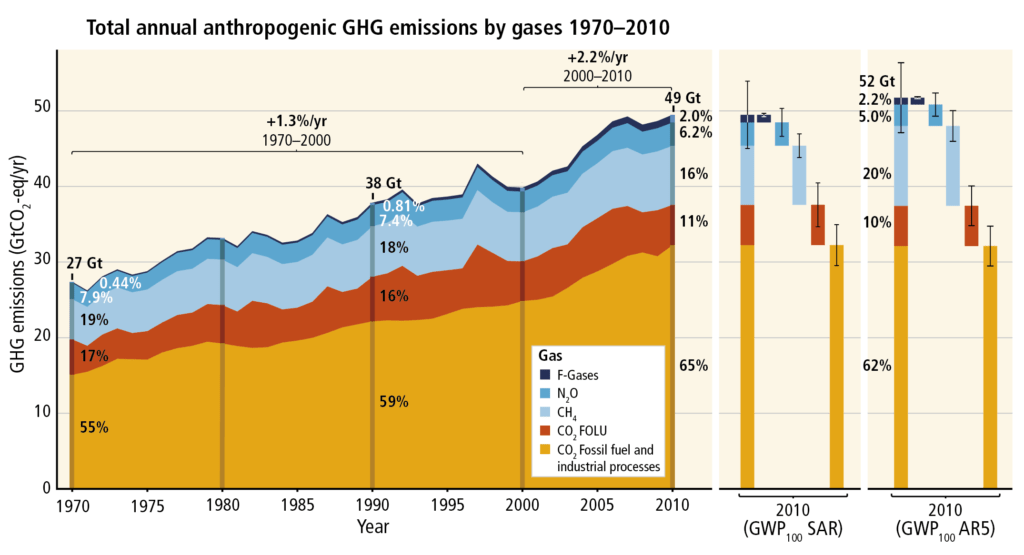
Coming back to that number, ~49 gigatonnes of carbon dioxide equivalent (or CO2e, though I’m going to mostly keep avoiding acronyms), that just means 49 billion metric tonnes of carbon dioxide, which is the same as saying 49 trillion kilograms, which is basically the same as saying 50 trillion kilograms.
For 2019, the Global Carbon Project has estimated that total carbon dioxide emissions alone were ~43 gigatonnes, and while I’m struggling to find an estimate of the carbon dioxide equivalent emissions for 2019, I suspect they fell not too far shy of 60 gigatonnes.
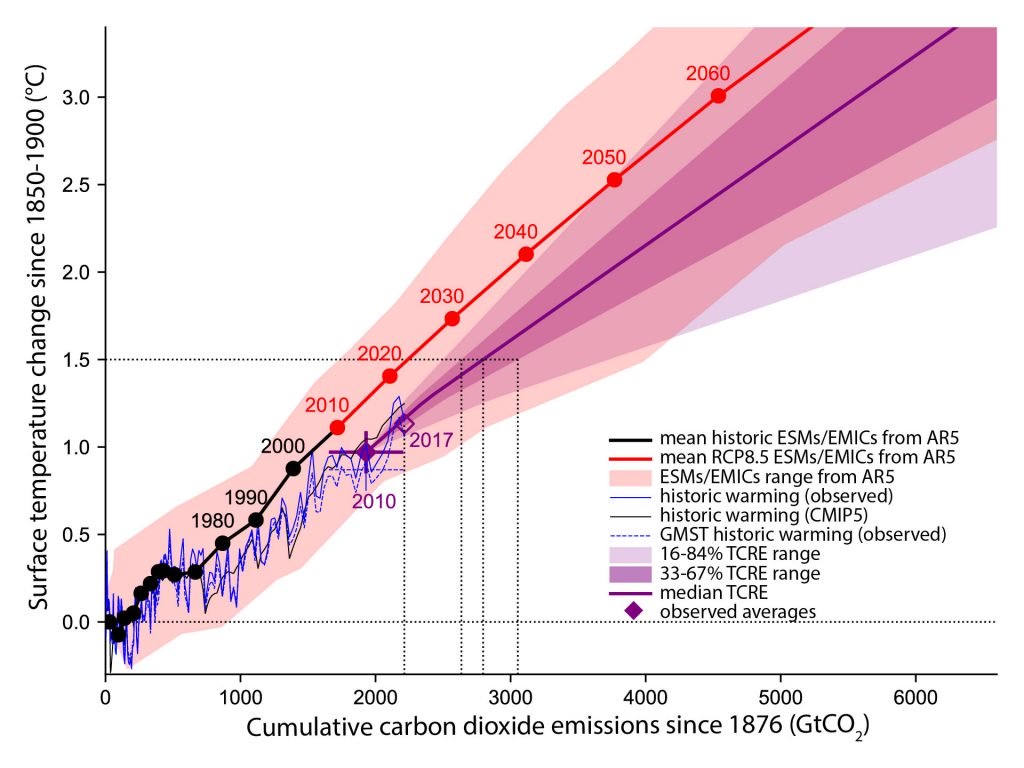
Finally, it’s important to have a sense of the total historical anthropogenic emissions. It’s surprisingly hard to find good graphs (perhaps because the underlying data is so mind-boggling). Please don’t be daunted by the graph below – what it shows is that, up to 2010, cumulative anthropogenic carbon dioxide emissions were ~2,000 gigatonnes, so roughly 50x what was emitted globally last year. That should tell us just how much we are currently emitting, that 50 years like last year would come close to equaling the global historical total of carbon dioxide emissions.
Further, the graph shows that from 2017, there remained somewhere between ~500 to at most perhaps 800 gigatonnes of carbon dioxide budget to keep the total global mean temperature increase to 1.5 degrees Celsius or below. Carbon dioxide and other greenhouse gasses have continued to be emitted at ever higher rates in the meantime, and I think it’s fair to say that the current carbon dioxide budget may be as low as ~300 gigatonnes to stay below 1.5 degrees of warming, which gives us about seven more years like 2019. (Actually, we might have less than that, but I’m erring on the bright side.)
Key takeaways thus far:
- Atmospheric carbon dioxide concentrations are ~415 ppm;
- Atmospheric methane concentrations are ~2 ppm;
- Atmospheric nitrous oxide concentrations are ~300 ppb (or 0.3 ppm);
- Methane, nitrous oxide, and fluorine-containing refrigerant compounds are far less plentiful in Earth’s atmosphere than is carbon dioxide, but are far more powerful short-term warming agents (I’m intentionally eliding the long-term for now, as we first just have to stop the bleeding and survive this century).
- During the Holocene, atmospheric carbon dioxide concentrations were steady at ~280 ppm;
- Annual total greenhouse gas emissions have been steadily climbing since ~1870, and are now around 40+ gigatonnes per year of carbon dioxide and 50-60 gigatonnes per year of carbon dioxide equivalent;
- Total historic anthropogenic carbon dioxide emissions have been ~2,400 gigatonnes.
- Allowing for the immense uncertainties involved in trying to predict the future behavior of the Earth, there remains a carbon dioxide budget of perhaps ~300-600 gigatonnes (at the rosiest) to remain in the vicinity of 1.5 degrees Celsius warming, with the caveat that feedback loops (like the thawing of Arctic permafrost, the collapse of a major Antarctic ice sheet and its aftermath, etc.) confront researchers with profound uncertainties about actual future outcomes.
- If you’ve been paying attention, you’ll note that I’ve avoided mentioning greenhouse gases other than carbon dioxide relative to the carbon budget. You’re absolutely right. Short answer: Go read the whole IPCC Special Report, as it does, indeed, address “non-CO2 radiative forcing”!
Some Closing Remarks
The United States is responsible for ~25% of cumulative historical carbon dioxide emissions. In recent years, total U.S. greenhouse gas emissions have been ~6 gigatonnes carbon dioxide equivalent per year and ~5 gigatonnes carbon dioxide. Similar historical and present-tense blame/responsibility can be attributed to the E.U./major European powers, Russia, and to a lesser, but growing, extent China and India.
As always, the complexity of the technical, social, and political challenges involved in imagining and then achieving progress towards a more just and sustainable world are immense, and in some sense, the numbers are beside the point. If we all started living (very) differently tomorrow, the problem could be solved – or at least the deepening of the harm could be arrested – and we could dispense with all these technocratic technicalities. As it is, though, having some basic facility with the top-line numbers can be helpful; in fact, I’d say that we all should have such facility, and that failing to know climate basics at this point reflects a total abandonment of the love we need to show for ourselves, each other, and the planet.
Postscript: 350.org is named for the concentration (350 ppm) of carbon dioxide that the organization’s founders considered the highest “safe concentration of carbon dioxide in the atmosphere.” In fact, even 350 ppm – and definitely our current concentration (which is, again, in the vicinity of 415 ppm) – very likely corresponds, based on ice core records, to a global mean temperature multiple degrees Celsius warmer than that of the Holocene. If we care about ourselves, we should work – among a great many other things – to stay within the ~300 gigatonne carbon dioxide budget. If we care about a livable future, we should also be setting our minds and hearts to how to remove this vast excess of greenhouse gases from the atmosphere, which again, entails imagining and working for a better and very different world.
Post-postscript: for background on why staying below 1.5 degrees Celsius of warming is so important (if also increasingly unlikely), see the aforementioned IPCC report, or this round-up of its conclusions from the World Resources Institute.

One thought on “The Math”